Map Layers: Buttons, Toggles and Switches
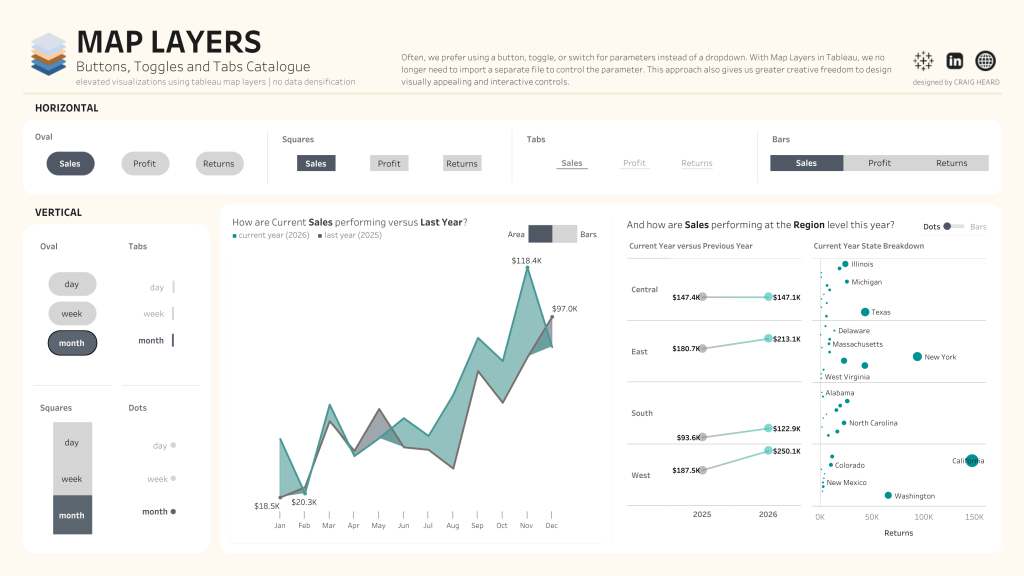
After watching The Flerlage Twins “Do Cool Stuff with Tableau” demonstration at Tableau conference I saw some tricks to how they create buttons by parameter actions. The Data School have an article…
I'm Craig, a statistician who turns football, music and whatever else catches my eye into data visualisations. Explore my Tableau Public work, the techniques behind it, and the tools I've built along the way.
 Three Decades of the Premier League
 Map Layers Visualization Catalogue
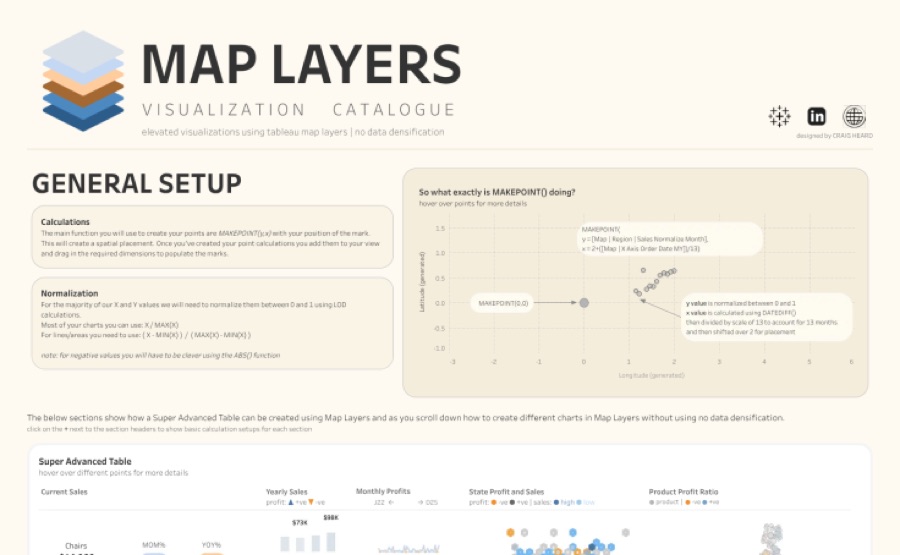 3× Viz of the Day 53k+ views on Tableau Public
Easier and more insightful footballer comparisons, built around radar profiles.
Get new posts and visualisations straight to your inbox.
After watching The Flerlage Twins “Do Cool Stuff with Tableau” demonstration at Tableau conference I saw some tricks to how they create buttons by parameter actions. The Data School have an article…
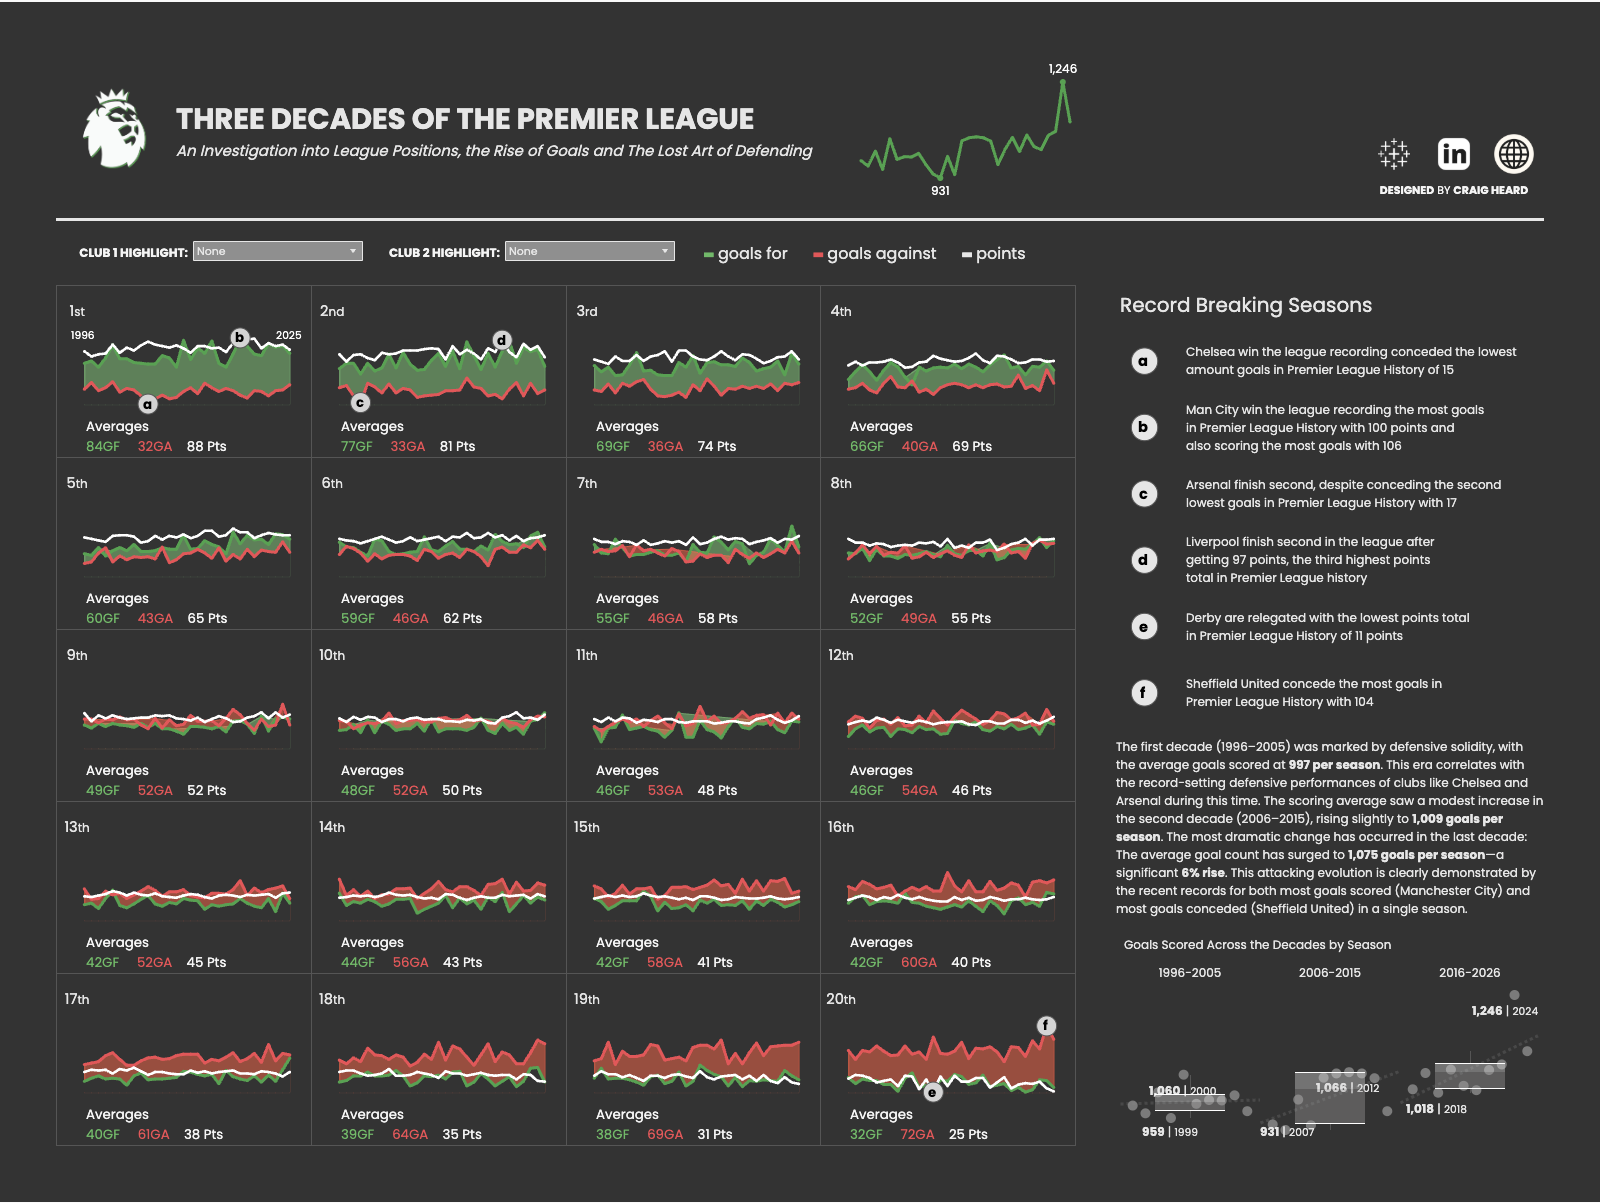
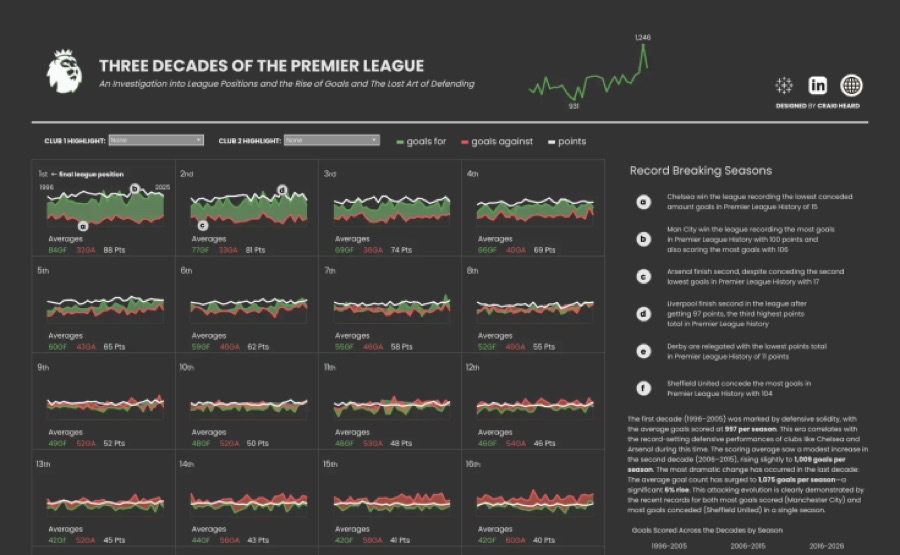
An Investigation into League Positions, the Rise of Goals and The Lost Art of Defending
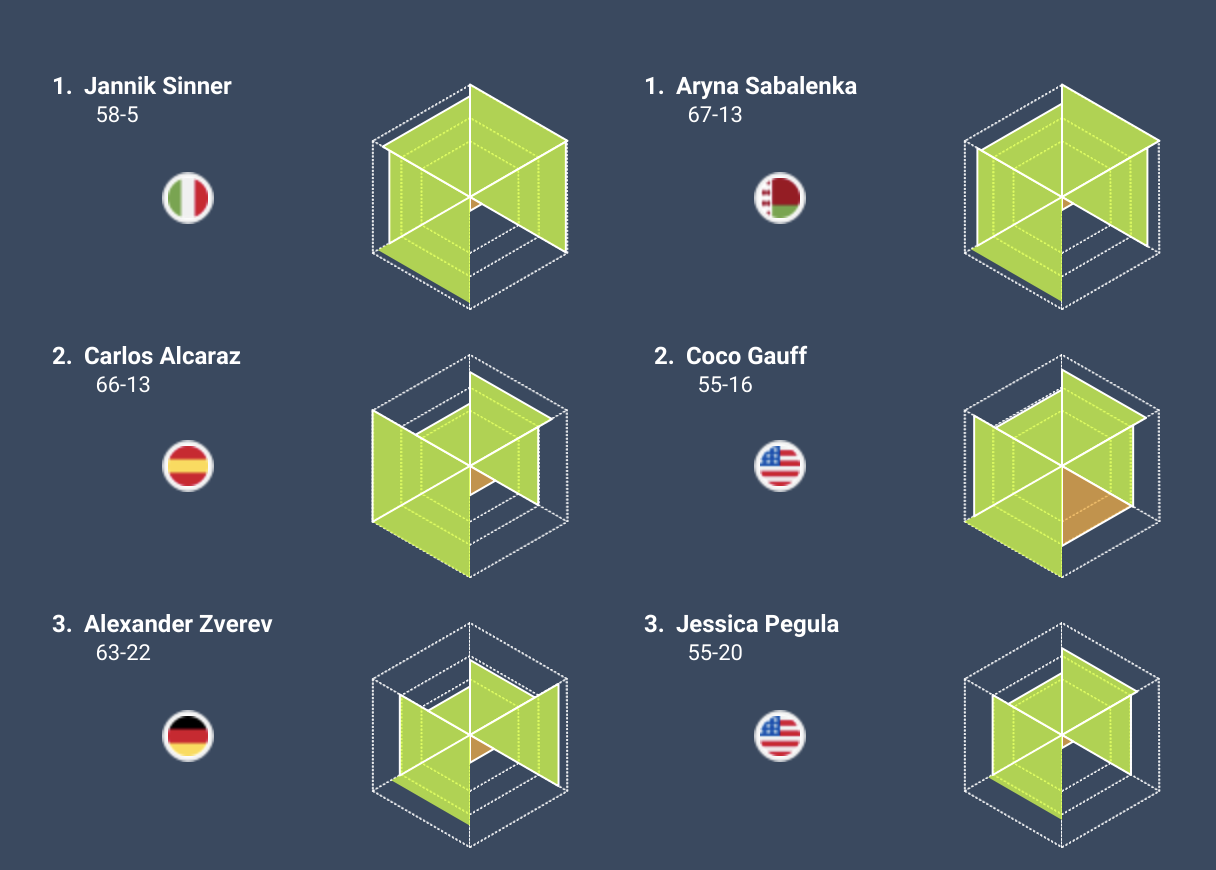
After my last blog, creating Hexagon Radar Charts, the next logical question is how do I do this for other polygons? With that being said Ill go ahead and leave this blog pretty short with the story,…
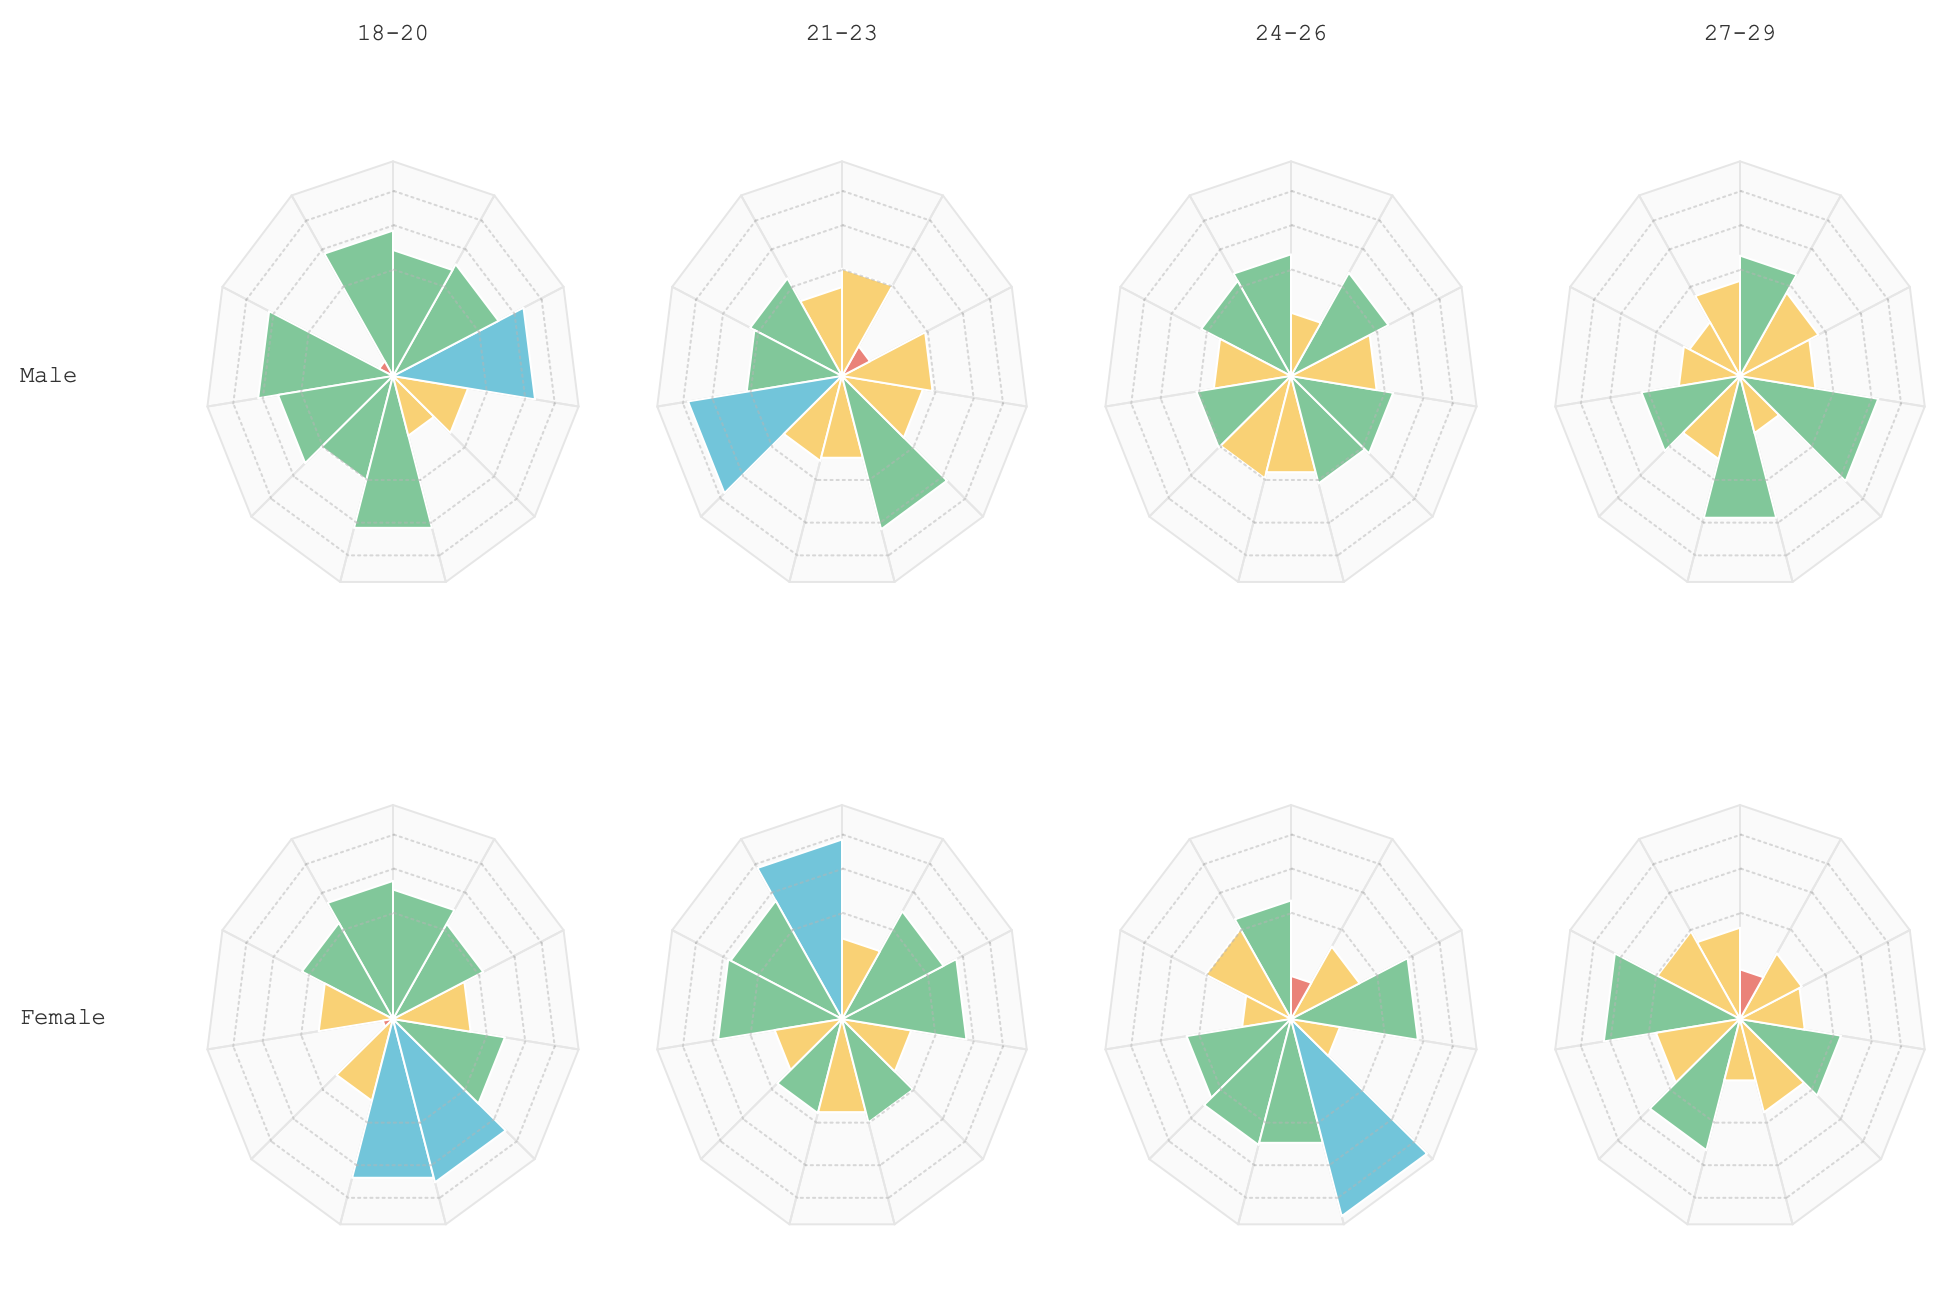
With the release of Multiple marks layer support in Tableau 2020.4, the possibilities for creating rich, complex visualizations have exploded. No longer limited to dual-axis hacks, advanced…
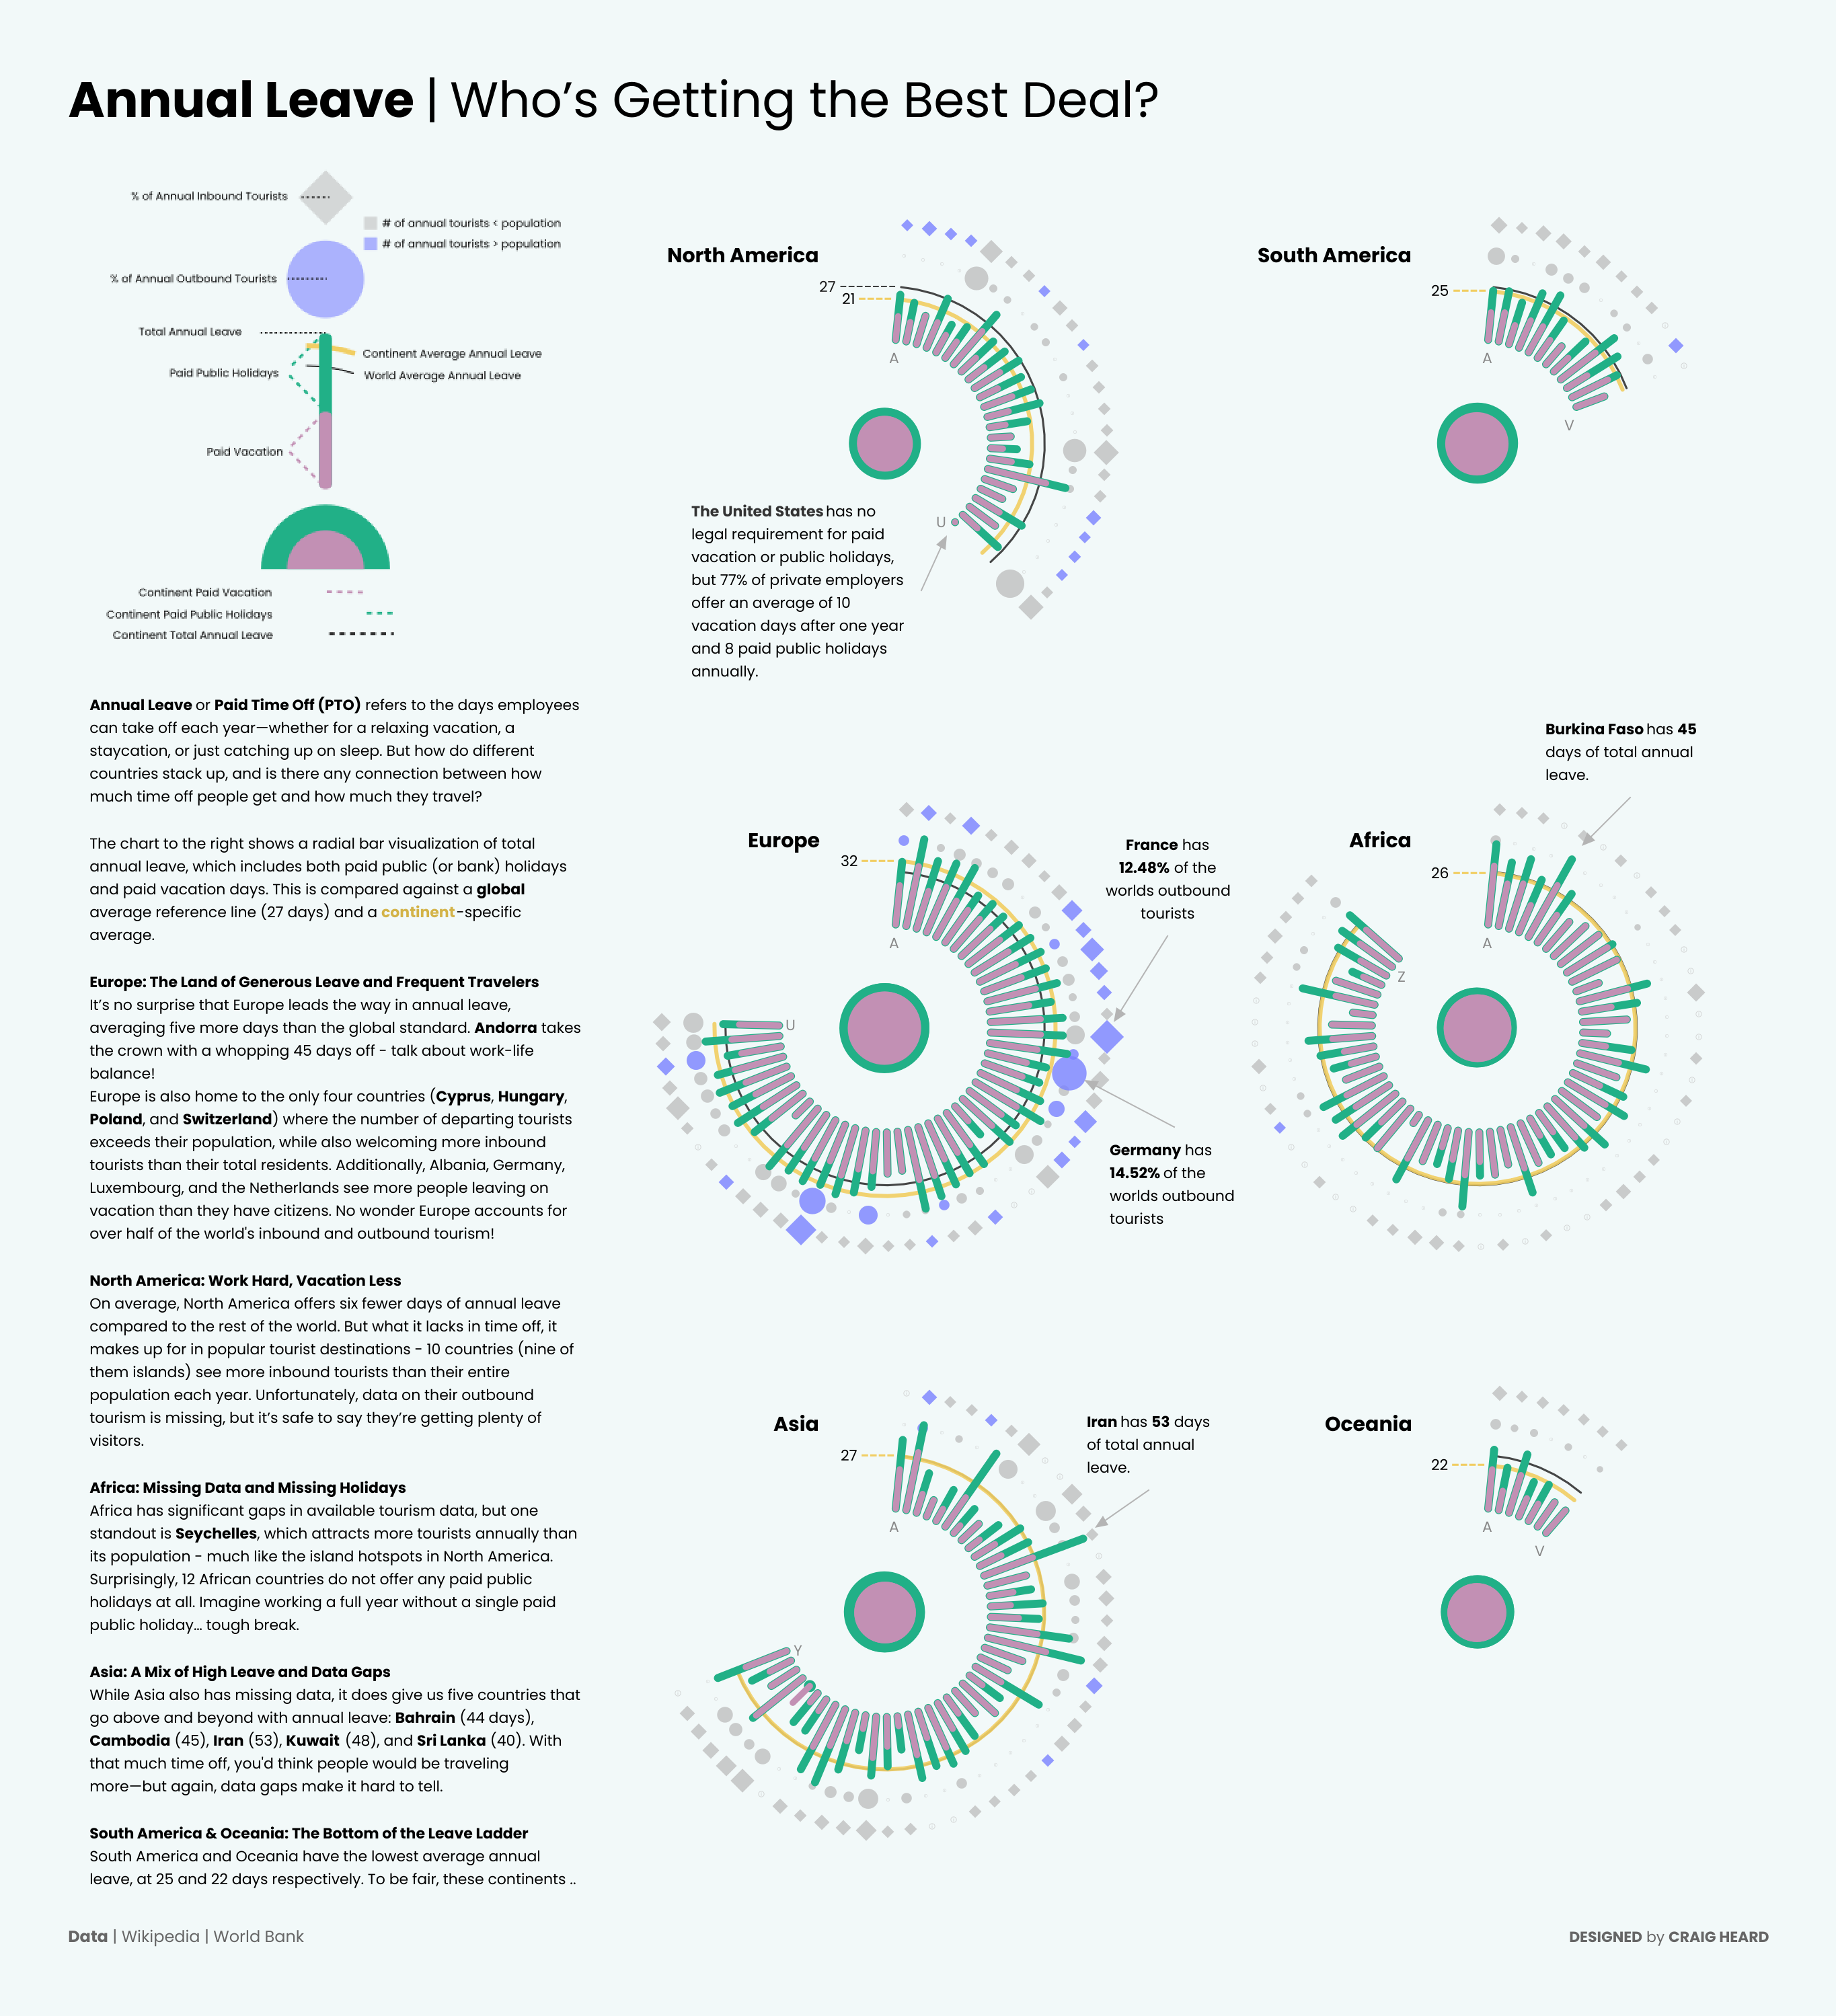
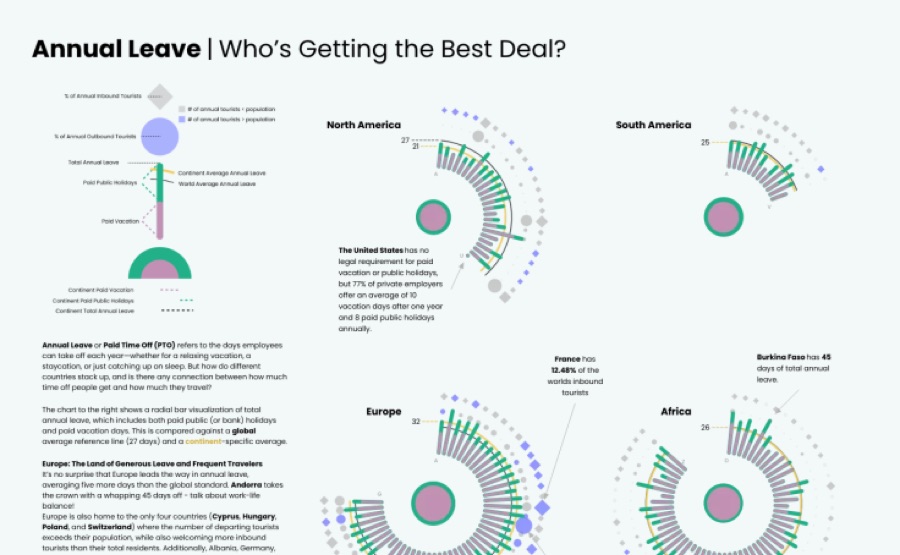
In a culture where it seems like all we do is work, I thought it would be interesting to take a deep dive into the annual leave data offered by country. I guess I am not the only person interested in…
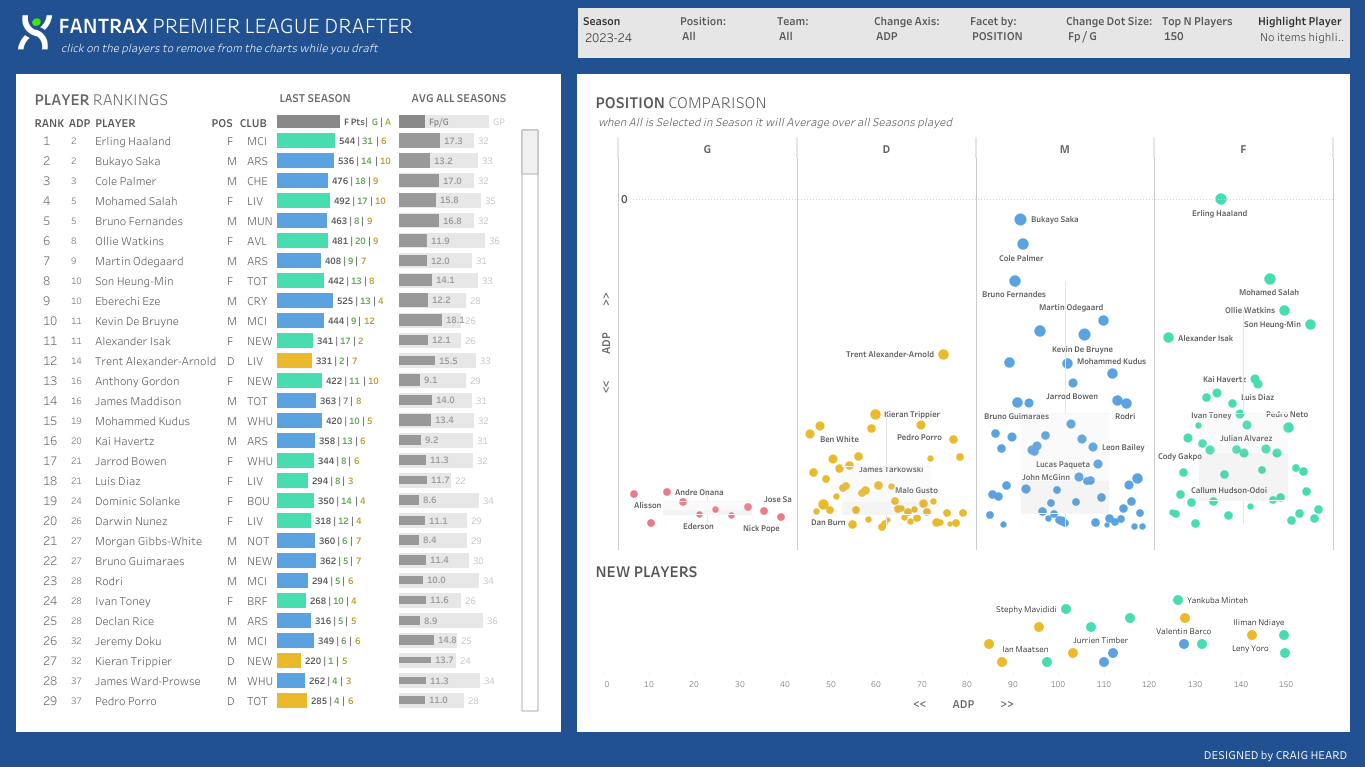
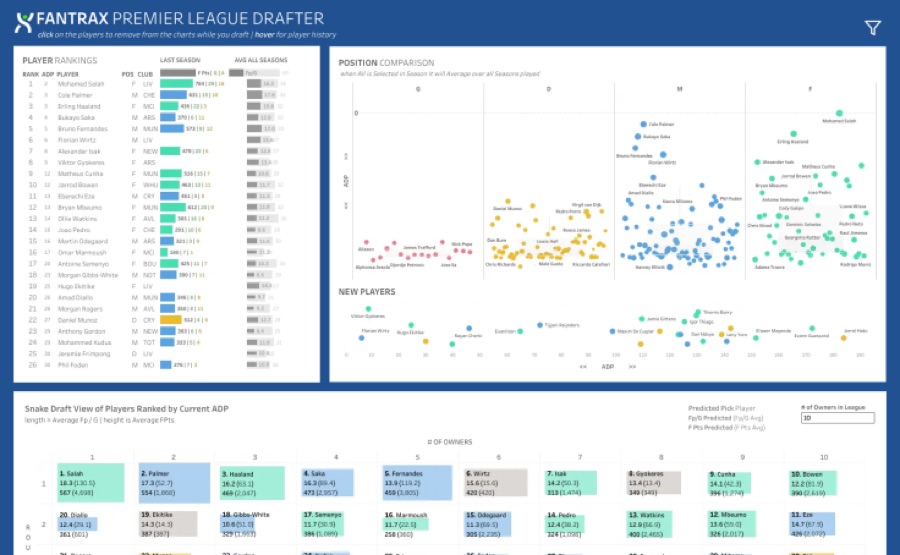
It's that time of the year again as you prepare for the Premier League Fantasy Draft season. If you love fantasy, however have decided to step away from the frustrating FPL Draft system to the…
Write-ups of the visualisations I build, with the techniques and templates behind them.
8 postsScripts I've written to pull the data I need, and how to use them as templates.
2 postsMy weekly Fantrax Premier League column, which ran through the 2025–26 season. The full archive lives here.
39 postsEverything else I'm interested in.
0 postsAll 46 of my Tableau Public visualisations, filterable by topic.
46 vizzes
I'm originally from Northampton, England, and moved to the US in 2010 on a football (soccer) scholarship to the University of Kentucky. There I earned a BS in Mathematics and Statistics, followed by a Master's in Statistics in 2017.
dataheard is where I bring those interests together, using data visualisation to explore whatever has caught my attention, from Premier League history to setlists and Spotify.